matplotlib绘图实例3:染色体直线示意图
Dec 02, 2010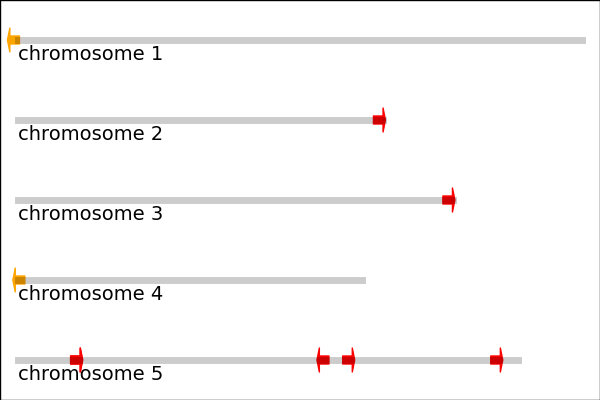
现学现卖,画来玩玩的,用来做slides里的示意图。感觉如果扩展一下加入zoom-in,zoom-out和slider的话,可以做成基因组浏览器(Genome Browser,比如IGV)。
这个画的是2个MIRNA165基因(橙色箭头)和7个MIRNA166基因(红色箭头,有2个位置很近看起来重合)在Arabidopsis thaliana(我们最爱滴模式植物)5条染色体上的位置。
箭头方向表明基因转录方向,右方向表明基因在正链,左方向表示基因在负链。箭头起点是MIRNA基因位置,箭头长度没意义(这里用的固定长度,因为MIRNA太短了,在整条染色体上,按正常比例看,就是一个点)。
染色体长度数据可以从TAIR获得,MIRNA位置是用的pre-miRNA估计的,有误差,数据来自miRBase。
import numpy as np
import matplotlib.pyplot as plt
import matplotlib.lines as mlines
import matplotlib.patches as mpatches

# data start here
# length of the chromosomes
chromosome_length = {1: 30427671,
        2: 19698289,
        3: 23459830,
        4: 18585056,
        5: 26975502}

longest_chromosome = float(max(chromosome_length.values()))

# positions of the data points
# key=chromosome, value=tuple of the start position and the strand
positions165 = {1:((79037,'-'),),
                4:((370012,'-'),)}

positions166 = {2: ((19176108,'+'),),
                3: ((22922206,'+'),),
                5: ((2838635,'+'),(2840622,'+'),(16775662,'-'),
                    (17516301,'+'),(25504798,'+'))}

# data end here

fig = plt.figure(figsize=(6,4))
ax = plt.axes([0,0,1,1])

# create 1 x N (number of chromosomes) grid to plot the chromosomes
N = len(chromosome_length)
pos = np.mgrid[0:1:1, 0:1:1.0/N].reshape(2, -1)

# leave some blank space at the border
xshift = 0.03
yshift = 0.1

# add one line for each chromosome
for k, v in chromosome_length.items():
    # calculate line length proportional to the chromosome length
    x,y = np.array([[xshift,xshift+
        (1-2*xshift)*v/longest_chromosome], [yshift,yshift]])
    line = mlines.Line2D(x+pos[0,N-k], y+pos[1,N-k],
        lw=5,alpha=0.2,color='k')
    plt.text(xshift+pos[0,N-k], yshift+pos[1,N-k]-0.05,
        'chromosome %d'%k, ha='left', size=14)
    ax.add_line(line)

# add one short colored arrow for each data point
colors = ('orange','red')
all_positions = (positions165,positions166)
for positions,color in zip(all_positions,colors):
    for k, v in positions.items():
        for start,strand in v:
            x,y = xshift+(1-2*xshift)*start/longest_chromosome,
                yshift
            # xoffset is the direction and length of the arrow
            if strand == '+':
                xoffset = 0.02
            else:
                xoffset = -0.02
            arrow = mpatches.Arrow(x+pos[0,N-k], y+pos[1,N-k],
                xoffset, 0, width=0.1,color=color)
            ax.add_patch(arrow)

ax.set_xticks([])
ax.set_yticks([])

plt.show()
#plt.savefig('positions.png')