Python Matplotlib logarithmic scatter plot
Mar 04, 2008Source: http://mail.python.org/pipermail/python-list/2006-February/369976.html
from pylab import *
def log_10_product(x, pos):
"""The two args are the value and tick position.
Label ticks with the product of the exponentiation"""
return '%1i' % (x)
ax = subplot(111)
# Axis scale must be set prior to declaring the Formatter
# If it is not the Formatter will use the default log labels for ticks.
ax.set_xscale('log')
ax.set_yscale('log')
formatter = FuncFormatter(log_10_product)
ax.xaxis.set_major_formatter(formatter)
ax.yaxis.set_major_formatter(formatter)
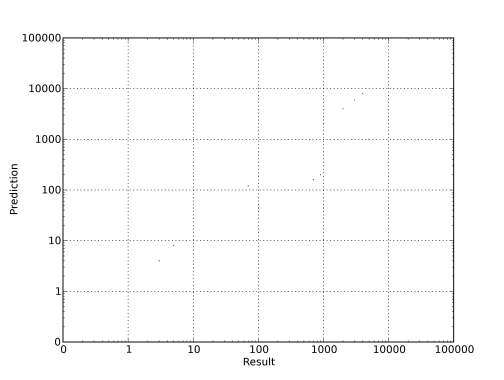
ax.scatter( [3, 5, 70, 700, 900], [4, 8, 120, 160, 200], s=8, c='b',
marker='s', faceted=False)
ax.scatter( [1000, 2000, 3000, 4000, 5000], [2000, 4000, 6000, 8000,
1000], s=8, c='r', marker='s', faceted=False)
ax.set_xlim(1e-1, 1e5)
ax.set_ylim(1e-1, 1e5)
grid(True)
xlabel(r"Result", fontsize = 12)
ylabel(r"Prediction", fontsize = 12)
show()
结果如图