from matplotlib import rc
# Change the default font
font = {'family' : 'sans-serif',
'sans-serif' : 'Arial',
'size' : '14.0'}
rc('font', **font)

import numpy as np
import matplotlib.pyplot as plt
import pickle

def set_properties(ax):
    ax.plot((-0.05,1.05),(0.25,0.25),'g')
    ax.plot((0.25,0.25),(-0.05,1.05),'g')
    ax.set_xlabel('A. thaliana precision')
    ax.set_ylabel('A. lyrata precision')
    ax.set_xlim((-0.05,1.05))
    ax.set_xticks(np.arange(0,1.05,0.2))
    ax.set_ylim((-0.05,1.05))
    ax.set_yticks(np.arange(0,1.05,0.2))
    ax.set_aspect(1./ax.get_data_ratio()) #make the figure in square shape

#Read data from file
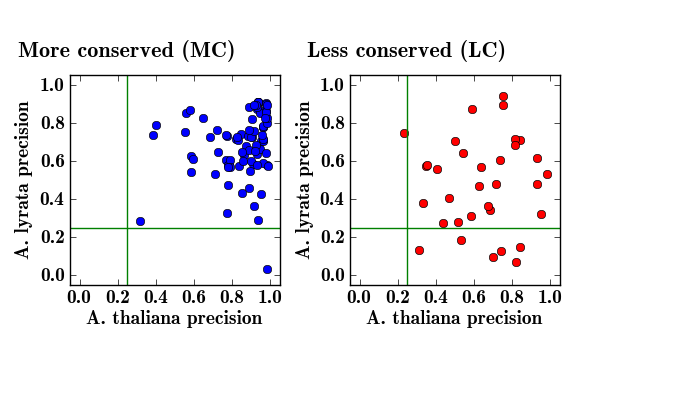
athMC,alyMC,athLC,alyLC = pickle.load(open('precision.p'))

fig = plt.figure(figsize=(7, 4))

ax1 = fig.add_axes([0.1, 0.05, 0.30, 1])
ax1.plot(athMC,alyMC,'bo')
set_properties(ax1)
plt.suptitle(r'More conserved (MC)',x=0.18,y=0.9,color='k',fontsize=16)

ax2 = fig.add_axes([0.5, 0.05, 0.30, 1])
ax2.plot(athLC,alyLC,'ro')
set_properties(ax2)
plt.suptitle(r'Less conserved (LC)',x=0.58,y=0.9,color='k',fontsize=16)

plt.show()
#plt.savefig('expression_precision_scatterplot.png')
#plt.savefig('expression_precision_scatterplot.ps')
