matplotlib绘图实例2:color mesh
Apr 29, 2010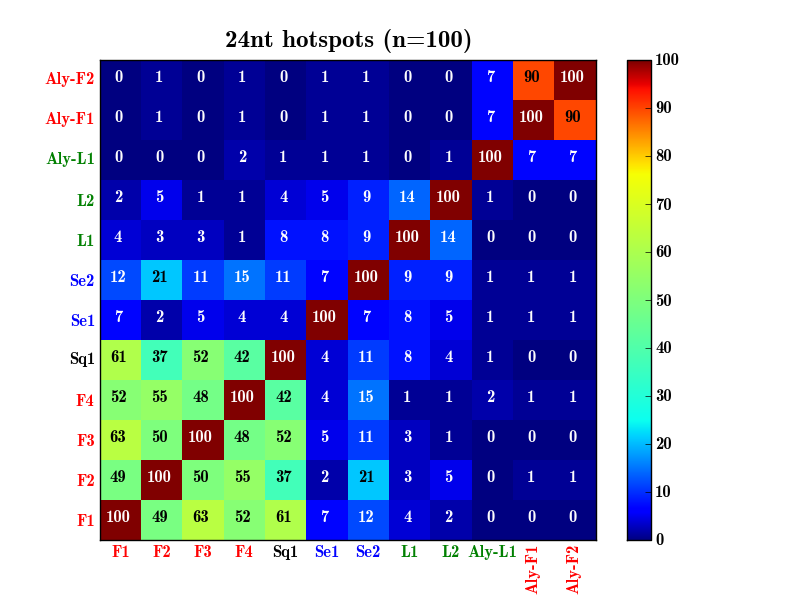
此图的目的是两两比较不同样本的相似性,有点类似于基因芯片的 heatmap,感兴趣其生物学意义的筒子可以看paper。这个是草图,后来保存成ps格式导入Adobe Illustrator修改了不少地方。
以下是Python代码:
from matplotlib import rc

# Change the default font
font = {'family' : 'sans-serif',
'sans-serif' : 'Arial',
'size' : '12.0'}
rc('font', **font)

import matplotlib
import numpy as np
import matplotlib.pyplot as plt
import math

def sqrt_sym(x):
    ''' A function to scale the colormap for better definition at both ends.'''
    sqrt_sym = math.sqrt(x*2-1) if x > 0.5 else -math.sqrt(1-x*2)
    return (sqrt_sym+1)/2

def cmap_xmap(function,cmap):
    ''' Applies function, on the indices of colormap cmap. Beware, function
     should map the [0, 1] segment to itself, or you are in for surprises.
     Third-party function. Source:
     http://www.scipy.org/Cookbook/Matplotlib/ColormapTransformations
    '''
    cdict = cmap._segmentdata
    function_to_map = lambda x : (function(x[0]), x[1], x[2])
    for key in ('red','green','blue'):
        cdict[key] = map(function_to_map, cdict[key])
        cdict[key].sort()
        print cdict
        assert (cdict[key][0]<0 or cdict[key][-1]>1),
            'Resulting indices extend out of the [0, 1] segment.'
    return matplotlib.colors.LinearSegmentedColormap('colormap',cdict,1024)

def set_xtick(ax):
    plt.xticks(np.arange(0.5,12.5,1), ('F1', 'F2', 'F3', 'F4',
    'Sq1', 'Se1', 'Se2','L1', 'L2', 'Aly-L1','Aly-F1','Aly-F2') )
    plt.setp([ax.get_xticklabels()[0],ax.get_xticklabels()[1],ax.get_xticklabels()[2],
       ax.get_xticklabels()[3],ax.get_xticklabels()[10],ax.get_xticklabels()[11]], rotation=0,color = 'r')
    plt.setp([ax.get_xticklabels()[7],ax.get_xticklabels()[8],ax.get_xticklabels()[9]], rotation=0,color = 'g')
    plt.setp([ax.get_xticklabels()[5],ax.get_xticklabels()[6]], rotation=0,color = 'b')
    plt.setp([ax.get_xticklabels()[4]], rotation=0, color = 'k')
    plt.setp([ax.get_xticklabels()[10],ax.get_xticklabels()[11]], rotation=90,color = 'r')

def set_ytick(ax):
    plt.yticks(np.arange(0.5,12.5,1), ('F1', 'F2', 'F3', 'F4',
        'Sq1', 'Se1', 'Se2','L1', 'L2', 'Aly-L1','Aly-F1','Aly-F2') )
    plt.setp([ax.get_yticklabels()[0],ax.get_yticklabels()[1],ax.get_yticklabels()[2],
        ax.get_yticklabels()[3],ax.get_yticklabels()[10],ax.get_yticklabels()[11]], rotation=0, color = 'r')
    plt.setp([ax.get_yticklabels()[7],ax.get_yticklabels()[8], ax.get_yticklabels()[9]], rotation=0, color = 'g')
    plt.setp([ax.get_yticklabels()[5],ax.get_yticklabels()[6]], rotation=0,color = 'b')
    plt.setp([ax.get_yticklabels()[4]], rotation=0, color = 'k')

def set_tick_invisible(ax):
    xtl = ax.get_xticklines() + ax.get_yticklines()
    for t in xtl:
        t.set_visible(False)

def autolabel(arrayA):
    ''' label each colored square with the corresponding data value.
    If value > 20, the text is in black, else in white.
    '''
    for i in range(12):
        for j in range(12):
            if 20 < arrayA[i,j] < 100:
                plt.text(j+0.45,i+0.45, arrayA[i,j], ha='center', va='bottom',color='k')
            else:
                plt.text(j+0.45,i+0.45, arrayA[i,j], ha='center', va='bottom',color='w')

plotData = [100, 49, 63, 52, 61, 7, 12, 4, 2, 0, 0, 0,
    49, 100, 50, 55, 37, 2, 21, 3, 5, 0, 1, 1,
    63, 50, 100, 48, 52, 5, 11, 3, 1, 0, 0, 0,
    52, 55, 48, 100, 42, 4, 15, 1, 1, 2, 1, 1,
    61, 37, 52, 42, 100, 4, 11, 8, 4, 1, 0, 0,
    7, 2, 5, 4, 4, 100, 7, 8, 5, 1, 1, 1,
    12, 21, 11, 15, 11, 7, 100, 9, 9, 1, 1, 1,
    4, 3, 3, 1, 8, 8, 9, 100, 14, 0, 0, 0,
    2, 5, 1, 1, 4, 5, 9, 14, 100, 1, 0, 0,
    0, 0, 0, 2, 1, 1, 1, 0, 1, 100, 7, 7,
    0, 1, 0, 1, 0, 1, 1, 0, 0, 7, 100, 90,
    0, 1, 0, 1, 0, 1, 1, 0, 0, 7, 90, 100]
plotArray = np.array(plotData)
plotArray = plotArray.reshape(12,12)

fig = plt.figure()
ax = fig.add_subplot(111)

mymap = cmap_xmap(sqrt_sym,plt.cm.jet)
plt.pcolormesh(plotArray,cmap=mymap)

plt.title('24nt hotspots (n=100)',fontsize=18)
set_xtick(ax)
set_ytick(ax)
set_tick_invisible(ax)
autolabel(plotArray)

plt.colorbar(orientation='vertical')

plt.show()
#plt.savefig('hotspots_24nt.png')
#plt.savefig('hotspots_24nt.ps')